

Research Unsolved Homicide Statistics: A Analyst’s Guide

Unsolved homicide statistics measure the gap between reported killings and cases closed by arrest or exceptional means, and that gap is wider than most analysts expect. The national homicide clearance rate hit an all-time low of 52.3% in 2022 before recovering to 61.4% in 2024. The cumulative backlog of unsolved cases since 1965 now exceeds 352,000. For researchers, journalists, and crime analysts, these figures are not just alarming headlines. They are the entry point into a complex data ecosystem built around FBI Uniform Crime Reports, the Murder Accountability Project, and state-level cold case databases.
What are homicide clearance rates and how do they affect unsolved murder statistics?
The homicide clearance rate is the primary metric used to track how many killings law enforcement resolves in a given year. A case is “cleared” when police make an arrest or close it by exceptional means. Exceptional means include situations where a suspect dies before charges are filed or a witness refuses to cooperate. This definition matters because a cleared case does not guarantee a conviction or trial.
Clearance statistics can be misleading by design. A department can close a case by exceptional means and count it as solved without ever presenting evidence in court. Analysts who treat clearance rates as a proxy for justice delivery will consistently overestimate how many homicides are truly resolved.
The historical trend makes the current situation more striking. The national clearance rate stood at 93% in 1962. It has declined steadily since then, driven by urbanization, reduced witness cooperation, and shifting investigative resources. The 2022 low of 52.3% means nearly half of all homicides that year went unresolved.
Disparities by victim demographics compound the problem further:
- Cases with Black victims show the sharpest clearance gaps. The decline from 1976 to 2017 in national clearance rates was driven almost entirely by cases involving Black victims, while rates for other groups remained stable or improved.
- Clearance rates for Black homicides can rise 2–3 times higher in racially integrated neighborhoods compared to predominantly Black ones, according to neighborhood-level analysis.
- Fatal shootings carry a 50% higher clearance rate than non-fatal shootings, a gap driven by resource allocation rather than case complexity.
Pro Tip: When reporting clearance rates, always specify whether the figure includes exceptional means closures. Stripping those out often cuts the effective resolution rate by several percentage points.
Where can you find reliable data on unsolved homicide cases?
Reliable crime investigation data comes from a short list of authoritative sources. Knowing which source to use for which question saves hours of misdirected research.
FBI Uniform Crime Reports
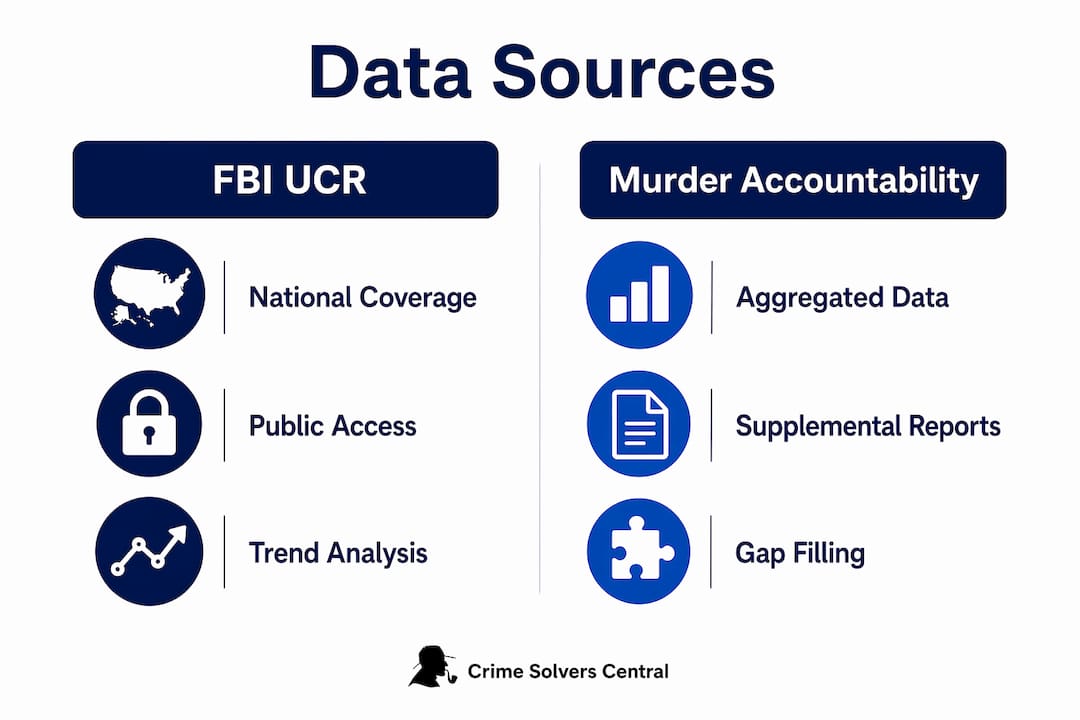
The FBI’s Uniform Crime Reporting (UCR) program is the most widely cited source for national homicide data. It collects annual submissions from thousands of law enforcement agencies and publishes clearance rates, victim demographics, and weapon types. The UCR’s main limitation is voluntary participation. Agencies that do not report create gaps in the national picture.

Murder Accountability Project
The Murder Accountability Project (MAP) fills some of those gaps. MAP aggregates FBI data with supplemental homicide reports and publishes agency-level clearance rates going back decades. It is the best source for tracking long-term trends and identifying which jurisdictions have the worst unsolved murder rates. Researchers can leverage national databases like MAP alongside UCR data to cross-validate findings.
State and local databases
Many states maintain their own cold case registries. These vary widely in completeness and public accessibility. Some states publish searchable online databases. Others require Freedom of Information Act (FOIA) requests to access case-level data. FOIA requests are time-consuming but often yield richer detail than aggregated federal reports, including investigator notes and forensic summaries.
Comparison of primary data sources
| Source | Coverage | Access | Best use |
|---|---|---|---|
| FBI UCR | National, annual | Public, free | Trend analysis, national benchmarks |
| Murder Accountability Project | National, historical | Public, free | Agency-level comparisons, long-term trends |
| State cold case registries | State-level, varies | Mixed, some FOIA required | Local research, case-level detail |
| FOIA requests | Jurisdiction-specific | Request-based | Investigative depth, primary sourcing |
Pro Tip: Cross-reference at least two sources before publishing any clearance rate figure. UCR and MAP often diverge at the agency level, and that divergence is itself a story worth investigating.
How do you analyze and interpret cold case statistics effectively?
Sound analysis of unsolved homicide data requires more than downloading a spreadsheet. The steps below reflect standard practice among crime analysts working with clearance and backlog data.
-
Define your unit of analysis. Decide whether you are measuring clearance rates at the national, state, city, or agency level. Each level tells a different story. National figures mask enormous local variation.
-
Separate fatal from non-fatal shootings. Fatal shootings receive disproportionately more investigative resources than non-fatal ones, even when victim and offender profiles overlap considerably. Mixing the two in a single clearance calculation distorts both figures.
-
Incorporate demographic and geographic variables. Race, neighborhood income, and population density all correlate with clearance outcomes. Structural economic conditions like unemployment and income inequality measurably affect how often homicides get solved. Any analysis that ignores these variables will produce misleading conclusions.
-
Use geospatial tools for pattern identification. Mapping unsolved cases by census tract or zip code reveals clustering that aggregate statistics hide. Tools like ArcGIS and QGIS allow analysts to overlay homicide data with socioeconomic indicators and police district boundaries.
-
Verify data accuracy before publishing. Cross-check agency-reported clearance rates against MAP data. Discrepancies often signal reporting errors or definitional differences in how agencies count exceptional means closures.
Key data table: U.S. homicide clearance trends
| Year | National clearance rate | Notes |
|---|---|---|
| 1962 | 93% | Historic high |
| 2022 | 52.3% | All-time low |
| 2024 | 61.4% | Partial recovery |
From 1980 to 2024, roughly 293,000 of approximately 792,000 homicides went unsolved. That figure represents a structural failure in the justice system, not a series of isolated investigative shortfalls.
What challenges distort unsolved homicide data and its implications?
The biggest challenge in cold case statistics is not data scarcity. It is data interpretation. Several systemic factors consistently distort what the numbers appear to show.
Victim demographics shape outcomes more than case complexity. The decline in clearance rates from 1976 to 2017 tracks almost entirely with cases involving Black victims. This is not a coincidence. It reflects decades of unequal resource allocation and eroded community trust in law enforcement. Analysts who ignore this pattern will misread the data.
Community trust is a measurable variable, not a soft factor. Research on neighborhood-level clearance rates shows that community trust toward police directly predicts whether witnesses come forward. Departments that invest in community relationships solve more homicides. This finding has direct implications for justice reform policy.
Clearance rates do not measure justice. A case cleared by exceptional means counts the same as one that results in a conviction. Analysts and journalists who cite raw clearance rates without this caveat overstate the system’s effectiveness.
Emerging approaches are beginning to address these gaps:
- Cold case audits systematically review old files for overlooked evidence. Crimesolverscentral covers why cold case audits generate new leads at a higher rate than passive case storage.
- Public engagement strategies, including collective memory triggers, are being used globally to surface new witness information in cases that have gone cold for decades.
- Crowdsourcing platforms allow community members to submit tips on unsolved homicide cases without direct contact with law enforcement, which lowers the barrier for witnesses in low-trust communities.
The decline in clearance rates does not just represent investigative failure. It erodes public confidence in law enforcement and deepens the sense among communities of color that their losses do not matter to the system.
Key Takeaways
The most reliable way to research unsolved homicide statistics is to combine FBI UCR data with Murder Accountability Project records, apply demographic controls, and treat clearance rates as a floor estimate rather than a measure of justice.
| Point | Details |
|---|---|
| Clearance rates are not convictions | A case cleared by exceptional means counts as solved without any arrest or trial. |
| The backlog is massive | Over 352,000 homicides have gone unsolved in the U.S. since 1965. |
| Race drives the clearance gap | The national decline in clearance rates from 1976 to 2017 is almost entirely explained by cases with Black victims. |
| Cross-source verification is required | FBI UCR and Murder Accountability Project data diverge at the agency level; use both. |
| Community trust predicts outcomes | Departments with stronger community relationships show measurably higher clearance rates. |
Why headline clearance rates tell only half the story
Clearance rates are the most cited number in homicide research, and they are also the most misread. After years of working with crime data, the pattern I keep seeing is analysts treating a 61% clearance rate as evidence that most homicides get solved. They do not. That 61% includes cases closed by exceptional means, cases where a suspect died before charges were filed, and cases where a witness refused to cooperate and the department simply moved on.
The more useful question is not “what is the clearance rate?” It is “what share of homicides result in a conviction?” That number is not published in any federal database. You have to build it yourself from court records and arrest data, which is exactly why most analysts never do it.
The racial disparity in clearance rates is the finding that should drive more reform conversations than it currently does. When clearance rates for Black victims are 2–3 times lower in segregated neighborhoods than in integrated ones, that is a measurable, documented inequity. Researchers and journalists have the data to make that case clearly. The gap between what the data shows and what policy reflects is where the real work needs to happen.
— Crime
How Crimesolverscentral supports your research
Crimesolverscentral maintains a national cold case database covering over 264,913 unsolved homicide and missing persons cases, organized by state and case type. For researchers and journalists who need case-level data beyond what federal reports provide, the platform offers direct access to categorized records that would otherwise require multiple FOIA requests to assemble. The database is searchable and regularly updated, making it a practical starting point for both statistical analysis and individual case investigation. Families seeking closure and analysts building regional trend reports use the same resource. Explore the unsolved homicide database to locate cases relevant to your research focus.
FAQ
What is the current U.S. homicide clearance rate?
The national homicide clearance rate recovered to 61.4% in 2024 after hitting an all-time low of 52.3% in 2022. That figure still means roughly four in ten homicides go unresolved each year.
How many unsolved homicides exist in the United States?
The cumulative backlog of unsolved homicides since 1965 exceeds 352,000 cases. Over 6,000 new unsolved cases were added in 2024 alone.
What does “cleared by exceptional means” mean in homicide statistics?
A case cleared by exceptional means is one closed without an arrest, typically because the suspect died, fled the country, or a witness refused to cooperate. These closures count toward clearance rates but do not result in prosecution.
Where can I find the most reliable data on unsolved murder rates?
The FBI Uniform Crime Reports and the Murder Accountability Project are the two most authoritative national sources. State cold case registries and FOIA requests provide deeper case-level detail for local research.
Why are clearance rates lower for Black homicide victims?
Research shows the national decline in clearance rates from 1976 to 2017 was driven almost entirely by cases with Black victims. Factors include unequal resource allocation and lower community trust in law enforcement, which reduces witness cooperation.