

Crime Hot Spot Analysis: A Guide for Law Enforcement

Crime hot spot analysis is a statistical and spatial technique that identifies small geographic areas where crime clusters at rates significantly higher than chance would predict. Formally called spatial crime analysis, it shifts policing focus from broad city districts down to specific street segments, intersections, and blocks. Methods like the Getis-Ord Gi* statistic, Kernel Density Estimation (KDE), and Geographic Information Systems (GIS) form the technical backbone of this work. For law enforcement professionals, researchers, and community organizers, understanding what is a crime hot spot analysis means understanding where to direct limited resources for the greatest public safety impact.
What is crime hot spot analysis and why does it matter?
Crime hot spot analysis statistically identifies micro-locations such as street segments where crime clusters significantly beyond random chance. That distinction matters because it separates genuine risk zones from areas that merely look busy on a map.
The practical payoff is direct. Crime mapping converts location data into actionable intelligence that supports evidence-based policing strategies. Departments that act on validated hot spots allocate patrol hours, community outreach, and prevention programs where they produce measurable results rather than spreading resources evenly across a jurisdiction.

The scale of concentration is striking. Research consistently shows that a small fraction of urban locations accounts for a disproportionately high share of all reported crime. Targeting those micro-places rather than entire neighborhoods reduces harm faster and avoids the community friction that comes with broad, unfocused enforcement.
What statistical methods are used in crime hot spot analysis?
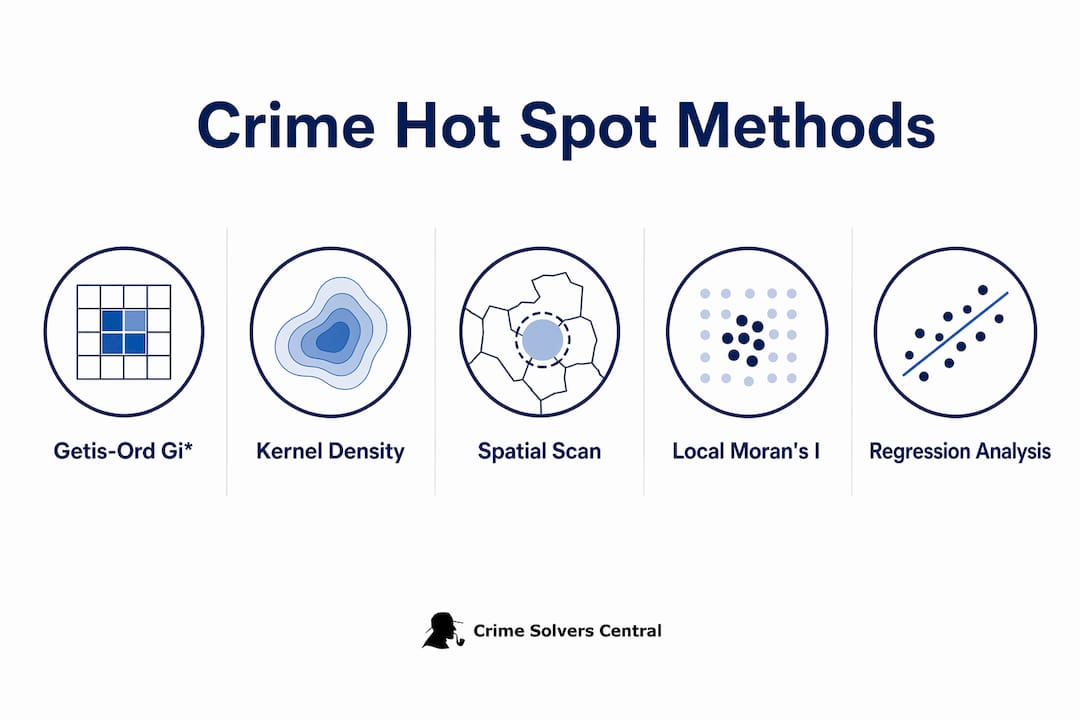
Two methods dominate the field: the Getis-Ord Gi* statistic and Kernel Density Estimation. Each serves a different analytical purpose, and using them together produces the most reliable results.
The Getis-Ord Gi* statistic mathematically proves that a cluster is statistically significant, reducing the risk of chasing noise. It measures spatial autocorrelation, meaning it tests whether high-crime locations are surrounded by other high-crime locations at a rate that cannot be explained by random variation. A location that passes this test is a true hot spot. One that fails is a visual artifact.
KDE takes a different approach. It spreads each crime incident outward like a smooth surface and sums the overlapping densities across a grid. The result is a continuous heat map showing where crime concentrates most intensely. KDE is excellent for visualization and for communicating risk patterns to non-technical audiences, including city councils and community boards.
- Getis-Ord Gi:* Tests statistical significance of spatial clusters; reduces false positives.
- Kernel Density Estimation: Produces continuous density surfaces; strong for visualization.
- GraphVenn method: A 2026 advancement that identifies optimal hotspot configurations beyond grid-based constraints, allowing analysts to find the best-fit cluster shapes rather than forcing data into fixed cells.
- Standard heat maps: Useful for communication but require statistical validation before driving operational decisions.
Pro Tip: Never present a KDE heat map to command staff as a confirmed hot spot. Run Getis-Ord Gi first to validate the cluster statistically, then use the heat map for presentation. Skipping validation is the most common source of misallocated patrol resources.*
How is crime hot spot analysis conducted in practice?
Effective analysis starts with data quality. Analysts need 3–6 months of high-quality incident data, typically calls for service and crime reports, loaded into a GIS platform for spatial visualization. Shorter time windows miss seasonal patterns. Longer windows can obscure recent shifts in crime geography.
The standard workflow follows these steps:
- Data collection and cleaning. Pull incident records, remove duplicates, correct geocoding errors, and standardize address formats. Dirty data produces misleading clusters.
- Spatial overlay. Import cleaned data into GIS and layer it against contextual features: bars, transit stops, schools, vacant lots, and known offender residences.
- Statistical analysis. Run Getis-Ord Gi* to identify statistically significant clusters. Supplement with KDE for density visualization.
- Contextual interpretation. Examine each validated hot spot against the spatial overlay. Determine whether the location functions as a crime generator, attractor, or enabler (explained in the next section).
- Validation and bias check. Review whether patrol patterns or reporting practices may have inflated incident counts in certain areas. Adjust interpretation accordingly.
- Operational output. Translate findings into patrol briefings, community meeting materials, or mobile mapping tools that officers can use in the field.
Data bias is the most underestimated risk in this process. Artificial hot spots can emerge when police concentrate patrols in an area, generating more reports there regardless of actual crime levels. Analysts must cross-reference multiple data sources, including hospital records and community tip lines, to test whether a cluster reflects real risk or enforcement patterns.
Pro Tip: Cross-reference crime reports with calls-for-service data. If calls are high but reports are low, the area may be underpoliced rather than low-crime. That gap is itself a signal worth investigating.
What are the different types of crime hot spots and their implications?
Not all hot spots form for the same reason. Different hot spot types have distinct causal mechanisms affecting targets, offenders, and situational controls. Treating them identically produces weak results.
Understanding the cause behind a hot spot is as important as knowing its location. A bar that draws intoxicated patrons and opportunistic offenders requires a different response than a poorly lit parking lot that creates situational opportunities for theft.
| Hot spot type | Primary cause | Example | Recommended response |
|---|---|---|---|
| Crime generator | High volume of people creates opportunity | Busy transit hub, shopping mall | Situational prevention, CCTV, environmental design |
| Crime attractor | Location draws motivated offenders | Open-air drug market, known fence location | Targeted enforcement, disruption of offender networks |
| Crime enabler | Weak controls allow crime to occur | Abandoned building, unlit alley | Code enforcement, lighting upgrades, community watch |
The generator-attractor-enabler framework, developed within the problem-oriented policing tradition, gives analysts and officers a shared vocabulary for diagnosing why crime concentrates in a specific place. That shared vocabulary is what turns a map into a strategy.
What are best practices for implementing hot spot analysis effectively?
Analysis that stays on a desk does not reduce crime. Connecting analysis to field operations with mobile mapping tools and real-time guidance for officers is what produces measurable outcomes.
The following practices separate departments that see results from those that do not:
- Update hot spot maps continuously. Crime patterns shift once policing focuses on an area. Static maps become outdated within weeks. Build a refresh cycle into the analysis workflow, at minimum monthly, and more frequently during high-crime seasons.
- Integrate outputs into patrol planning. Officers need specific guidance on what to do at a hot spot, not just where it is. Briefing materials should specify the hot spot type, the suspected mechanism, and the recommended tactic.
- Measure intervention outcomes. Track crime counts before and after deployment. Compare hot spot areas against control areas to isolate the effect of the intervention.
- Collaborate across agencies. Many hot spots cross jurisdictional lines. Sharing data with neighboring departments, transit authorities, and social service agencies produces a fuller picture and a more coordinated response.
- Engage community stakeholders. Residents and business owners hold contextual knowledge that no dataset captures. Their input helps validate hot spots and identify enablers that analysts cannot see from incident records alone. Platforms like Crimesolverscentral demonstrate how public databases aid law enforcement by making community-sourced information accessible at scale.
Pro Tip: Build a displacement check into every hot spot intervention. Map crime in the surrounding buffer zone before and after. If crime drops in the hot spot but rises in adjacent blocks, the intervention moved the problem rather than solving it.
Key Takeaways
Crime hot spot analysis works because it combines statistical validation with spatial context, turning raw incident data into targeted, evidence-based interventions that reduce crime at specific locations.
| Point | Details |
|---|---|
| Statistical validation is non-negotiable | Use Getis-Ord Gi* to confirm clusters are real, not visual artifacts from KDE maps. |
| Data quality determines output quality | Collect 3–6 months of cleaned incident data before running spatial analysis. |
| Hot spot type drives the response | Generators, attractors, and enablers each require a different prevention strategy. |
| Analysis must connect to field action | Mobile tools and patrol briefings translate maps into officer behavior and measurable outcomes. |
| Continuous updates sustain impact | Refresh hot spot maps regularly because crime displaces once targeted policing begins. |
Why hot spot analysis is only as good as the action it drives
Working with crime data over many years, the pattern I see most often is this: agencies invest in analysis and then underinvest in operationalizing it. A validated hot spot map sitting in an analyst’s folder is not a crime reduction strategy. It is a missed opportunity.
The field has made real progress on the technical side. The GraphVenn method and advances in real-time GIS integration mean analysts can now identify meaningful clusters faster and with greater confidence than was possible five years ago. What has not kept pace is the organizational infrastructure needed to act on those findings consistently.
The generator-attractor-enabler framework is the most underused tool in the practitioner’s kit. Departments that take the time to diagnose why a hot spot exists, not just where it is, design interventions that address root causes. Those interventions hold. The ones that skip the diagnosis tend to displace crime rather than reduce it.
Community involvement is not a soft add-on to this work. Residents and local organizations see things that incident reports miss. Platforms like Crimesolverscentral, which catalog over 264,913 cases and connect community members with law enforcement resources, show what is possible when public engagement is built into the infrastructure of crime analysis rather than treated as an afterthought.
The next frontier is not a better algorithm. It is better integration between analysts, officers, community members, and the data systems that connect them.
— Crime
Crimesolverscentral and the data behind crime prevention
Effective crime analysis depends on accessible, well-organized data. Crimesolverscentral maintains a national cold case database covering over 264,913 missing persons and unsolved homicide cases, categorized by state and situation. For researchers building spatial crime datasets, law enforcement professionals tracking geographic patterns in cold cases, and community organizers seeking to understand crime concentration in their areas, this database provides a starting point that few public resources match. The platform also supports community participation through membership and safety initiatives, making it a practical complement to formal crime analysis workflows. Visit Crimesolverscentral to access case records and connect with the resources your work requires.
FAQ
What is a crime hot spot in simple terms?
A crime hot spot is a small geographic area where crime occurs at a rate significantly higher than surrounding locations. Statistical methods like the Getis-Ord Gi* confirm that the concentration is real and not a product of random variation.
How do analysts identify crime hot spots?
Analysts load 3–6 months of incident data into a GIS platform, run spatial statistics like Kernel Density Estimation and Getis-Ord Gi*, and validate clusters against contextual overlays showing land use, facilities, and environmental factors.
What is the difference between a crime generator and a crime attractor?
A crime generator produces crime through high foot traffic and opportunity, such as a transit hub. A crime attractor draws motivated offenders to a specific location, such as an open-air drug market. Each type requires a different intervention strategy.
Why do crime hot spots change over time?
Hot spots shift because targeted policing displaces offender activity to nearby areas. Regular map updates, at minimum monthly, are necessary to track displacement and sustain crime reduction over time.
How does crime trend analysis differ from hot spot analysis?
Crime trend analysis tracks changes in crime volume or type over time across a jurisdiction. Hot spot analysis identifies where crime concentrates in space. The two methods are most effective when used together to understand both the timing and location of crime patterns.